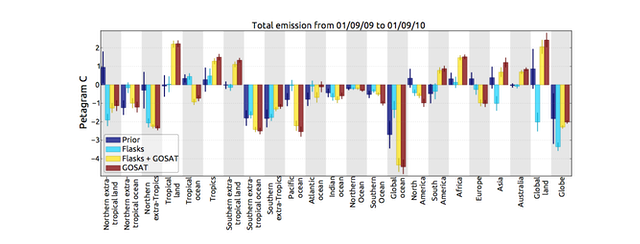
This picture from Basu et al. (2013) shows the aggregated CO2 emission between 1 September 2009 and 1 September 2010, partitioned over larger regions such as different continents and latitude bands. Emissions are estimated in a 4DVAR framework. “Prior" refers to the emissions before assimilation of observations. “Flasks” are the fluxes after assimilation of flask observations. “Flasks + GOSAT” represent fluxes after assimilation of both surface observations and GOSAT satellite observations. “GOSAT” is the result if only satellite observations are assimilated. The emission figures do not include fossil fuel emissions. Error bars denote 1σ errors.