Borsdorff, T., Tol, P., Williams, J. E., de Laat, J., aan de Brugh, J., Nédélec, P., Aben, I., and Landgraf, J.: Carbon monoxide total columns from SCIAMACHY 2.3 µm atmospheric reflectance measurements: towards a full-mission data product (2003–2012), Atmos. Meas. Tech., 9, 227-248, doi:10.5194/amt-9-227-2016, 2016


This papers presents a full-mission data product of carbon monoxide (CO) vertical column densities using the 2310–2338 nm SCIAMACHY reflectance measurements over clear-sky land scenes for the period January 2003–April 2012
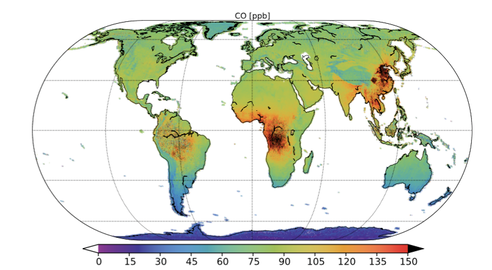
Figure 11 (top): CO wet air column averaged mixing ratios over land and clear-sky scenes. The values are averaged from January 2003 to April 2012 on a cylindrical equal area projection with 180 grid points in latitude and 360 in longitude.
Figure 12 (bottom) Time series of SCIAMACHY CO wet air column averaged mixing ratios (blue) over northern and southern hemispheric Africa compared with the calculation of the TM5 model (pink); 30-day medians are shown.