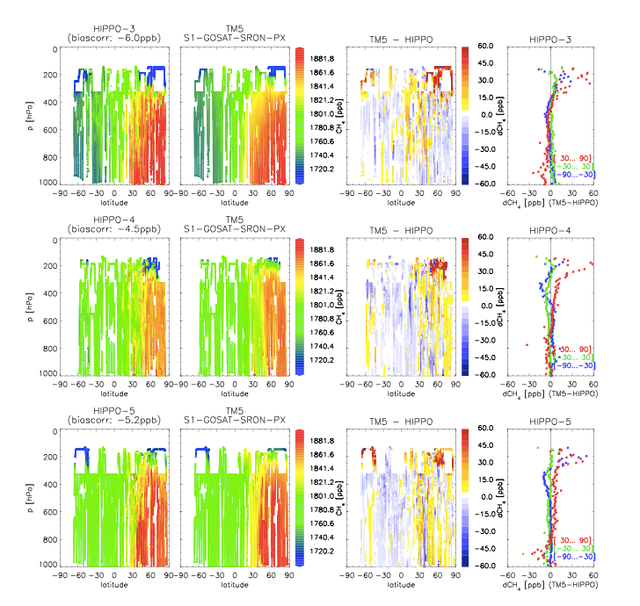
This picture is taken from Alexe et al. (2014). Simulation S1-GOSAT-SRON-PX (TM5 with assimilated GOSAT (GOSAT-PX) and NOAA surface data) is validated against HIPPO campaigns 3–5 (south-bound and northbound flights). Rightmost panels show the average bias as a function of latitude: extra-tropical Northern Hemisphere (NH) in red, extra-tropical SH in blue, and the tropics in green.